
Lab Report: Engineering Cross-Validation from First Principles
Welcome back to the lab. 🧪
In our previous experiments, we explored the foundations of prediction. If you haven’t read my deep dive into building a regression model yet, I highly recommend checking out Building Simple Linear Regression from Scratch first. That post sets the stage for what we are about to do today.
In that previous session, we trained a model on a dataset and saw it work. But a nagging question remained: Did the model actually learn the pattern, or did it just memorize the specific numbers I gave it?
Today, we are moving from building a model to stress-testing it. We are coding a Cross-Validation engine from scratch, using pure Python, without touching scikit-learn.
1. The Hypothesis: Why Do We Need This?
Imagine a student preparing for a university entrance exam.
- Scenario A: The student solves the same practice test 5 times. They eventually score 100%. Are they a genius, or did they just memorize the answer key?
- Scenario B: The student solves 5 different practice tests from different publishers. They score 90%, 85%, 92%, 60%, and 88%.
Scenario A is what happens when you train and test your model on the same data. It is an illusion. Scenario B is Cross-Validation.
We need a mechanism that splits our data into different “folds.” We train the model on some parts and test it on the unseen parts, rotating them until every data point has been used for both training and testing. This gives us the model’s true “reliability score.”
2. The Mechanics (No Magic Libraries)
Since I am currently focusing on the fundamentals and haven’t dived deep into Linear Algebra yet, I wanted to avoid building a complex Multivariate Regression model that I couldn’t fully explain. Instead, I wrapped our trusty Simple Linear Regression logic inside a Cross-Validation class.
Here is the mathematical logic we are implementing textually:
- The Split: We divide the data into ‘k’ equal groups.
- The Slope (Beta 1): We calculate how much ‘y’ changes when ‘x’ changes. This is done by calculating the Covariance (how they move together) and dividing it by the Variance (how ‘x’ moves individually).
- The Intercept (Beta 0): We anchor our line. The best-fitting line must pass through the average of x and the average of y.
- The Score (R-Squared): We measure success by comparing our model’s error against a “dumb” model that just guesses the average every time. If our score is 1 (or 100%), we eliminated all errors. If it is 0, we are no better than a random guess.
3. The Engine: ErsuCrossValidation
I designed a Python class to automate this rotation. It takes the dataset, shuffles it to remove any ordering bias, and then runs the training loop.
Here is the blueprint of the engine:
Decoding the Code
- The Shuffle: In the
__init__andcross_validationmethods, I use random indices. This is crucial because if the data is sorted (e.g., low to high), splitting it sequentially would result in training on low numbers and testing on high numbers, which would break the model. - The Zip Function: Python’s
zipis the hero here. When calculating covariance, we need to multiply the specificxvalue with its correspondingyvalue.ziplocks them together so we don’t calculate the variance of the whole population by mistake. - The Loop: The code iterates
ktimes. In each iteration (or fold), it mathematically carves out a specific slice of the list to be the “Test Set” and glues the remaining parts together to form the “Train Set.”
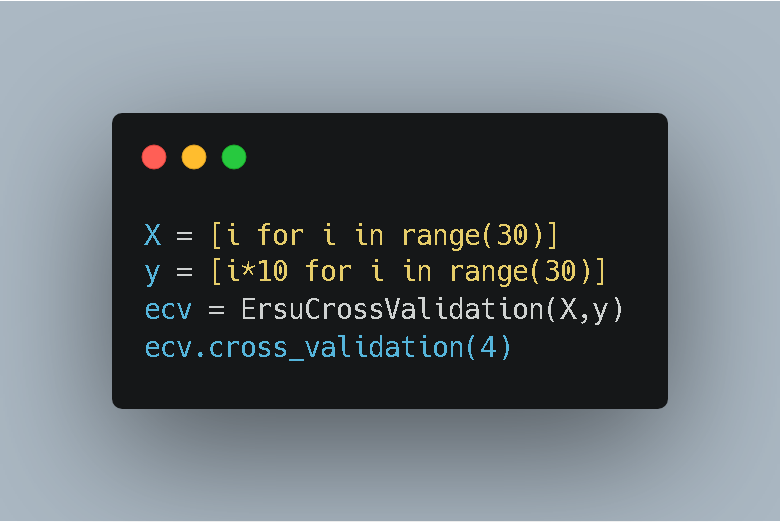
4. Experiment A: The Control Group (Basic Setup)
To verify the engine works, I started with a “perfect” environment. I created a dataset where y is exactly 10 times x. There is no noise, no randomness.
The Results:
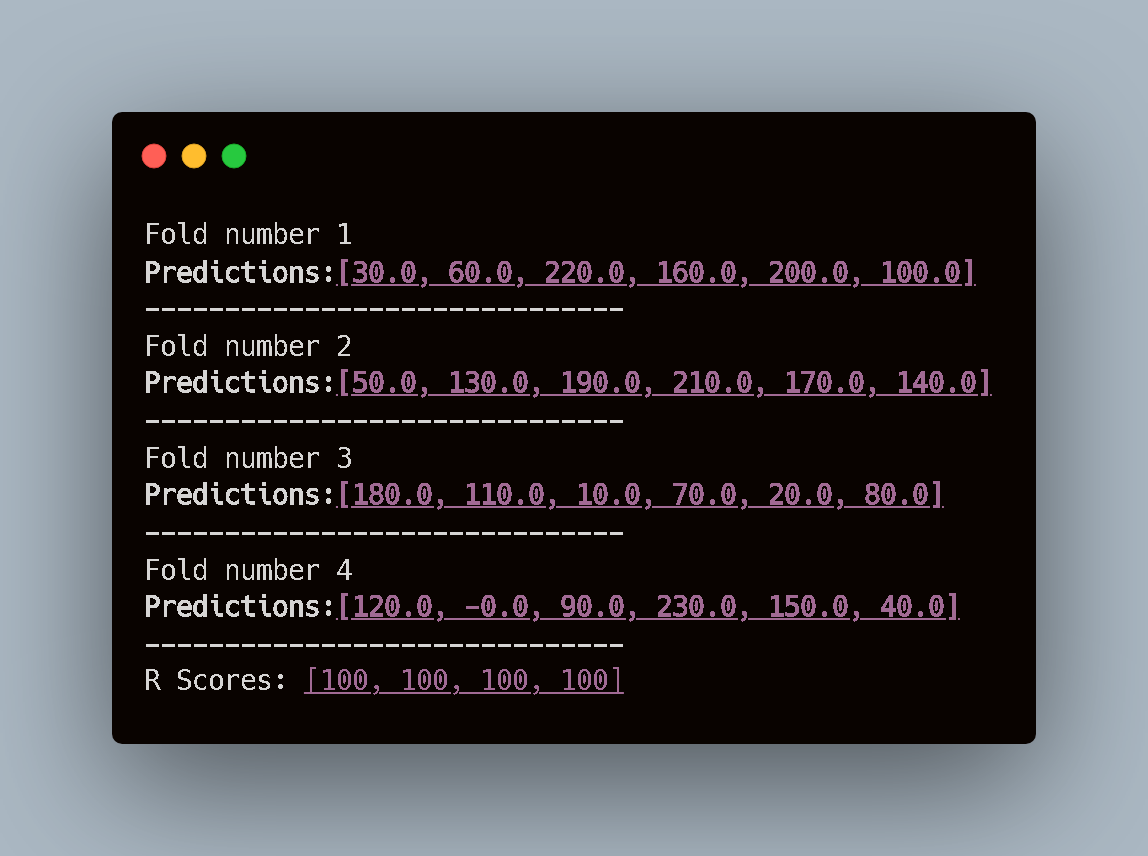
Observation: As expected, the R-Scores are consistently 100 (or 1.0). The model predicted every single value perfectly.
- Prediction: 30.0 vs Actual: 30.
- Prediction: 60.0 vs Actual: 60.
This confirms that the math inside the class (Variance, Covariance, Beta calculation) is functioning correctly. However, this doesn’t show the true value of Cross-Validation because the data is too clean.
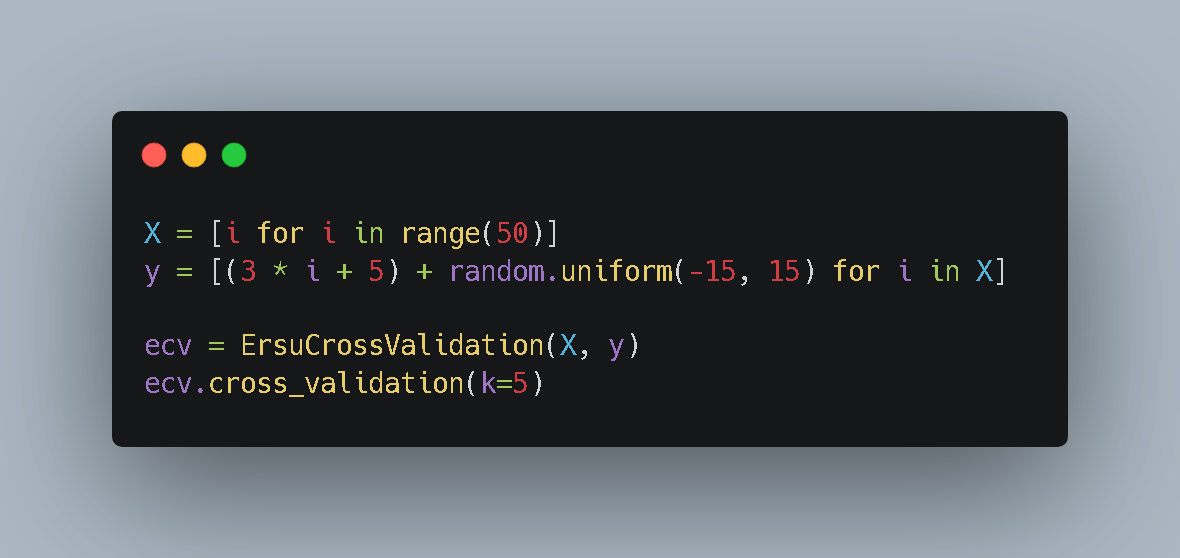
5. Experiment B: The Stress Test (Complex Setup)
Now, let’s introduce some chaos. Real-world data is never perfect lines.
I generated a dataset based on the equation y = 3x + 5, but I added random “noise” (values between -15 and +15) to every point. This simulates real-life measurement errors or natural variance.
The Results:
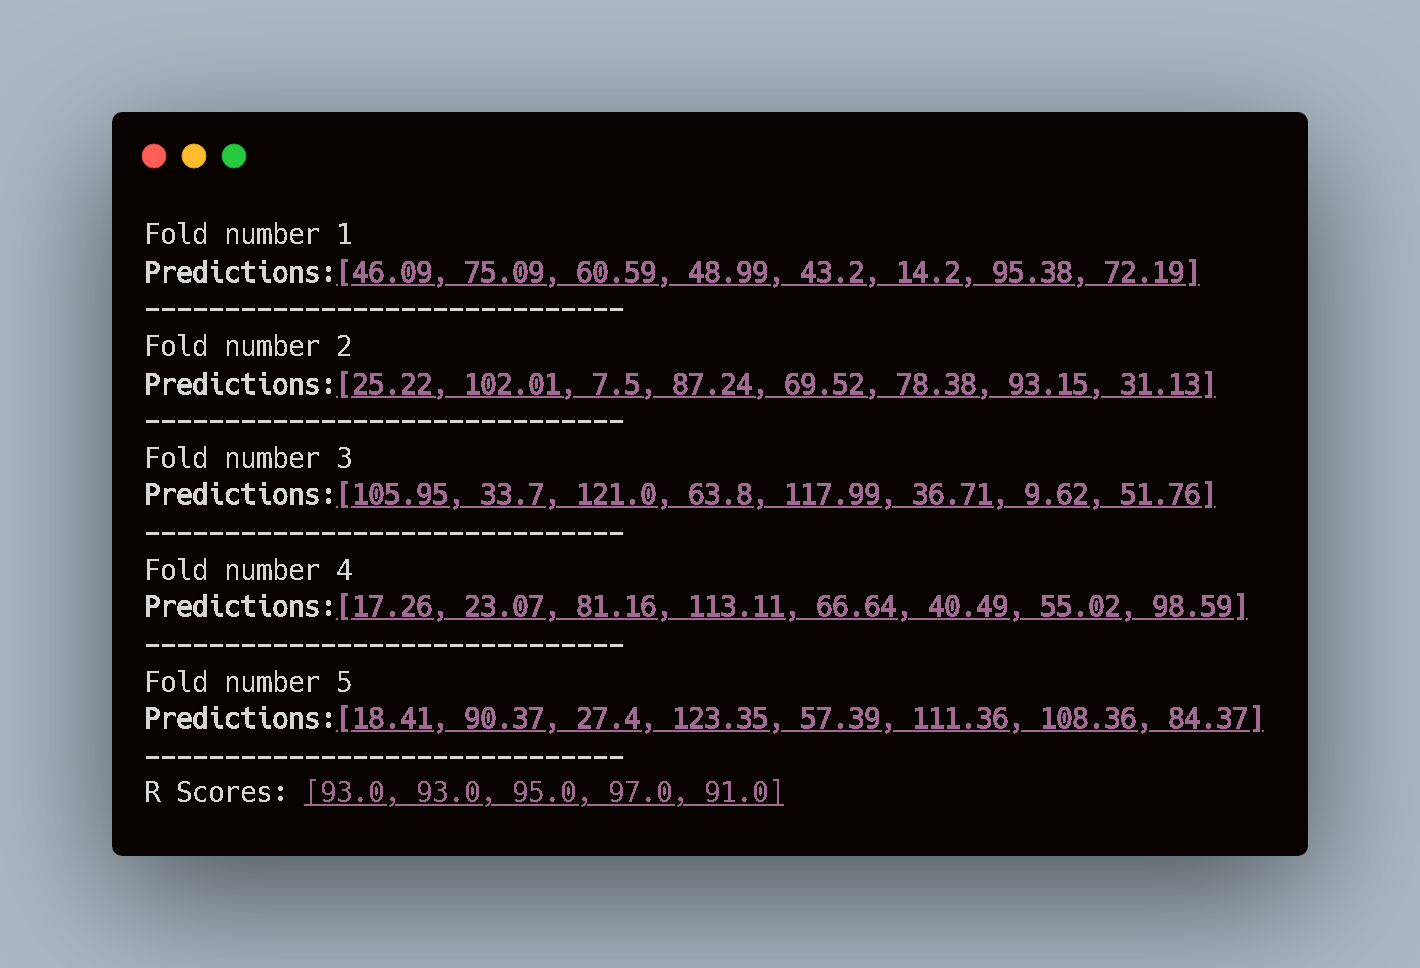
Observation: This is where Cross-Validation shines. Look at the R-Scores:
- Fold 1: 93.0%
- Fold 3: 95.0%
- Fold 4: 97.0%
- Fold 5: 91.0%
The model is the same. The logic is the same. But the performance changes depending on which subset of data it sees. If we had only tested on “Fold 4,” we might have been overconfident (97%). If we only saw “Fold 5,” we might have been disappointed (91%).
Cross-validation gives us the honest truth: “On average, this model explains about 93.8% of the variance, but expect fluctuations.”
Conclusion
Building this from scratch highlighted an important lesson: Reliability is a distribution, not a single number.
Since I used Simple Linear Regression for this experiment, the risk of “overfitting” was low (it’s hard to overfit a straight line). However, the infrastructure we built today—this ErsuCrossValidation class—is model-agnostic.
In future lab sessions, when we start building complex Polynomial Regressions or Neural Networks that are prone to memorizing data, this tool will be our primary line of defense.
Until then, keep breaking the black box. 🚀


