Under the Hood: Coding Variance and Z-Score from Scratch
Welcome back to the lab. 🧪
As data scientists (or aspiring ones like me), we often rely heavily on libraries like NumPy or Pandas. We type .var() or .std(), get a number, and move on. But recently, I’ve been asking myself: Do I really understand what happens inside that black box?
To test my understanding, I decided to ignore the libraries for a day. My mission: build a statistical analysis tool using pure Python, focusing on two critical concepts: Variance and Z-Score.
If you want to understand the foundational concepts of Mean and Standard Deviation better before diving into this code, check out my previous blog post: Visualizing Statistics: My Handwritten Notes.
1. The Concepts: Why Should We Care?
Before we write code, we need to understand the “why.”
Variance: The Archer’s Consistency
Imagine two archers.
- Archer A hits the bullseye once, then misses the target completely, then hits the edge. Their average shot is “okay,” but you can’t trust them.
- Archer B hits slightly to the left every single time.
Archer B has low variance. Their shots are clustered together. Archer A has high variance. Their data is “messy.” Variance tells us how much we can trust the average.
Z-Score: The Great Equalizer
This is my favorite concept. Imagine you got an 80 in Calculus and a 90 in History. Which is better? You can’t say “90 is higher” because the History exam might have been incredibly easy, while the Calculus exam was a nightmare where the class average was 40.
The Z-Score translates these different worlds into a common language. It tells you how many “standard deviations” you are away from the average. It allows us to compare apples and oranges scientifically.
2. The Math (Visualized)
Since the blog renderer sometimes struggles with complex notation, and I prefer seeing the geometry of math anyway, I sketched out the formulas we are about to implement.
This is the blueprint for our code:
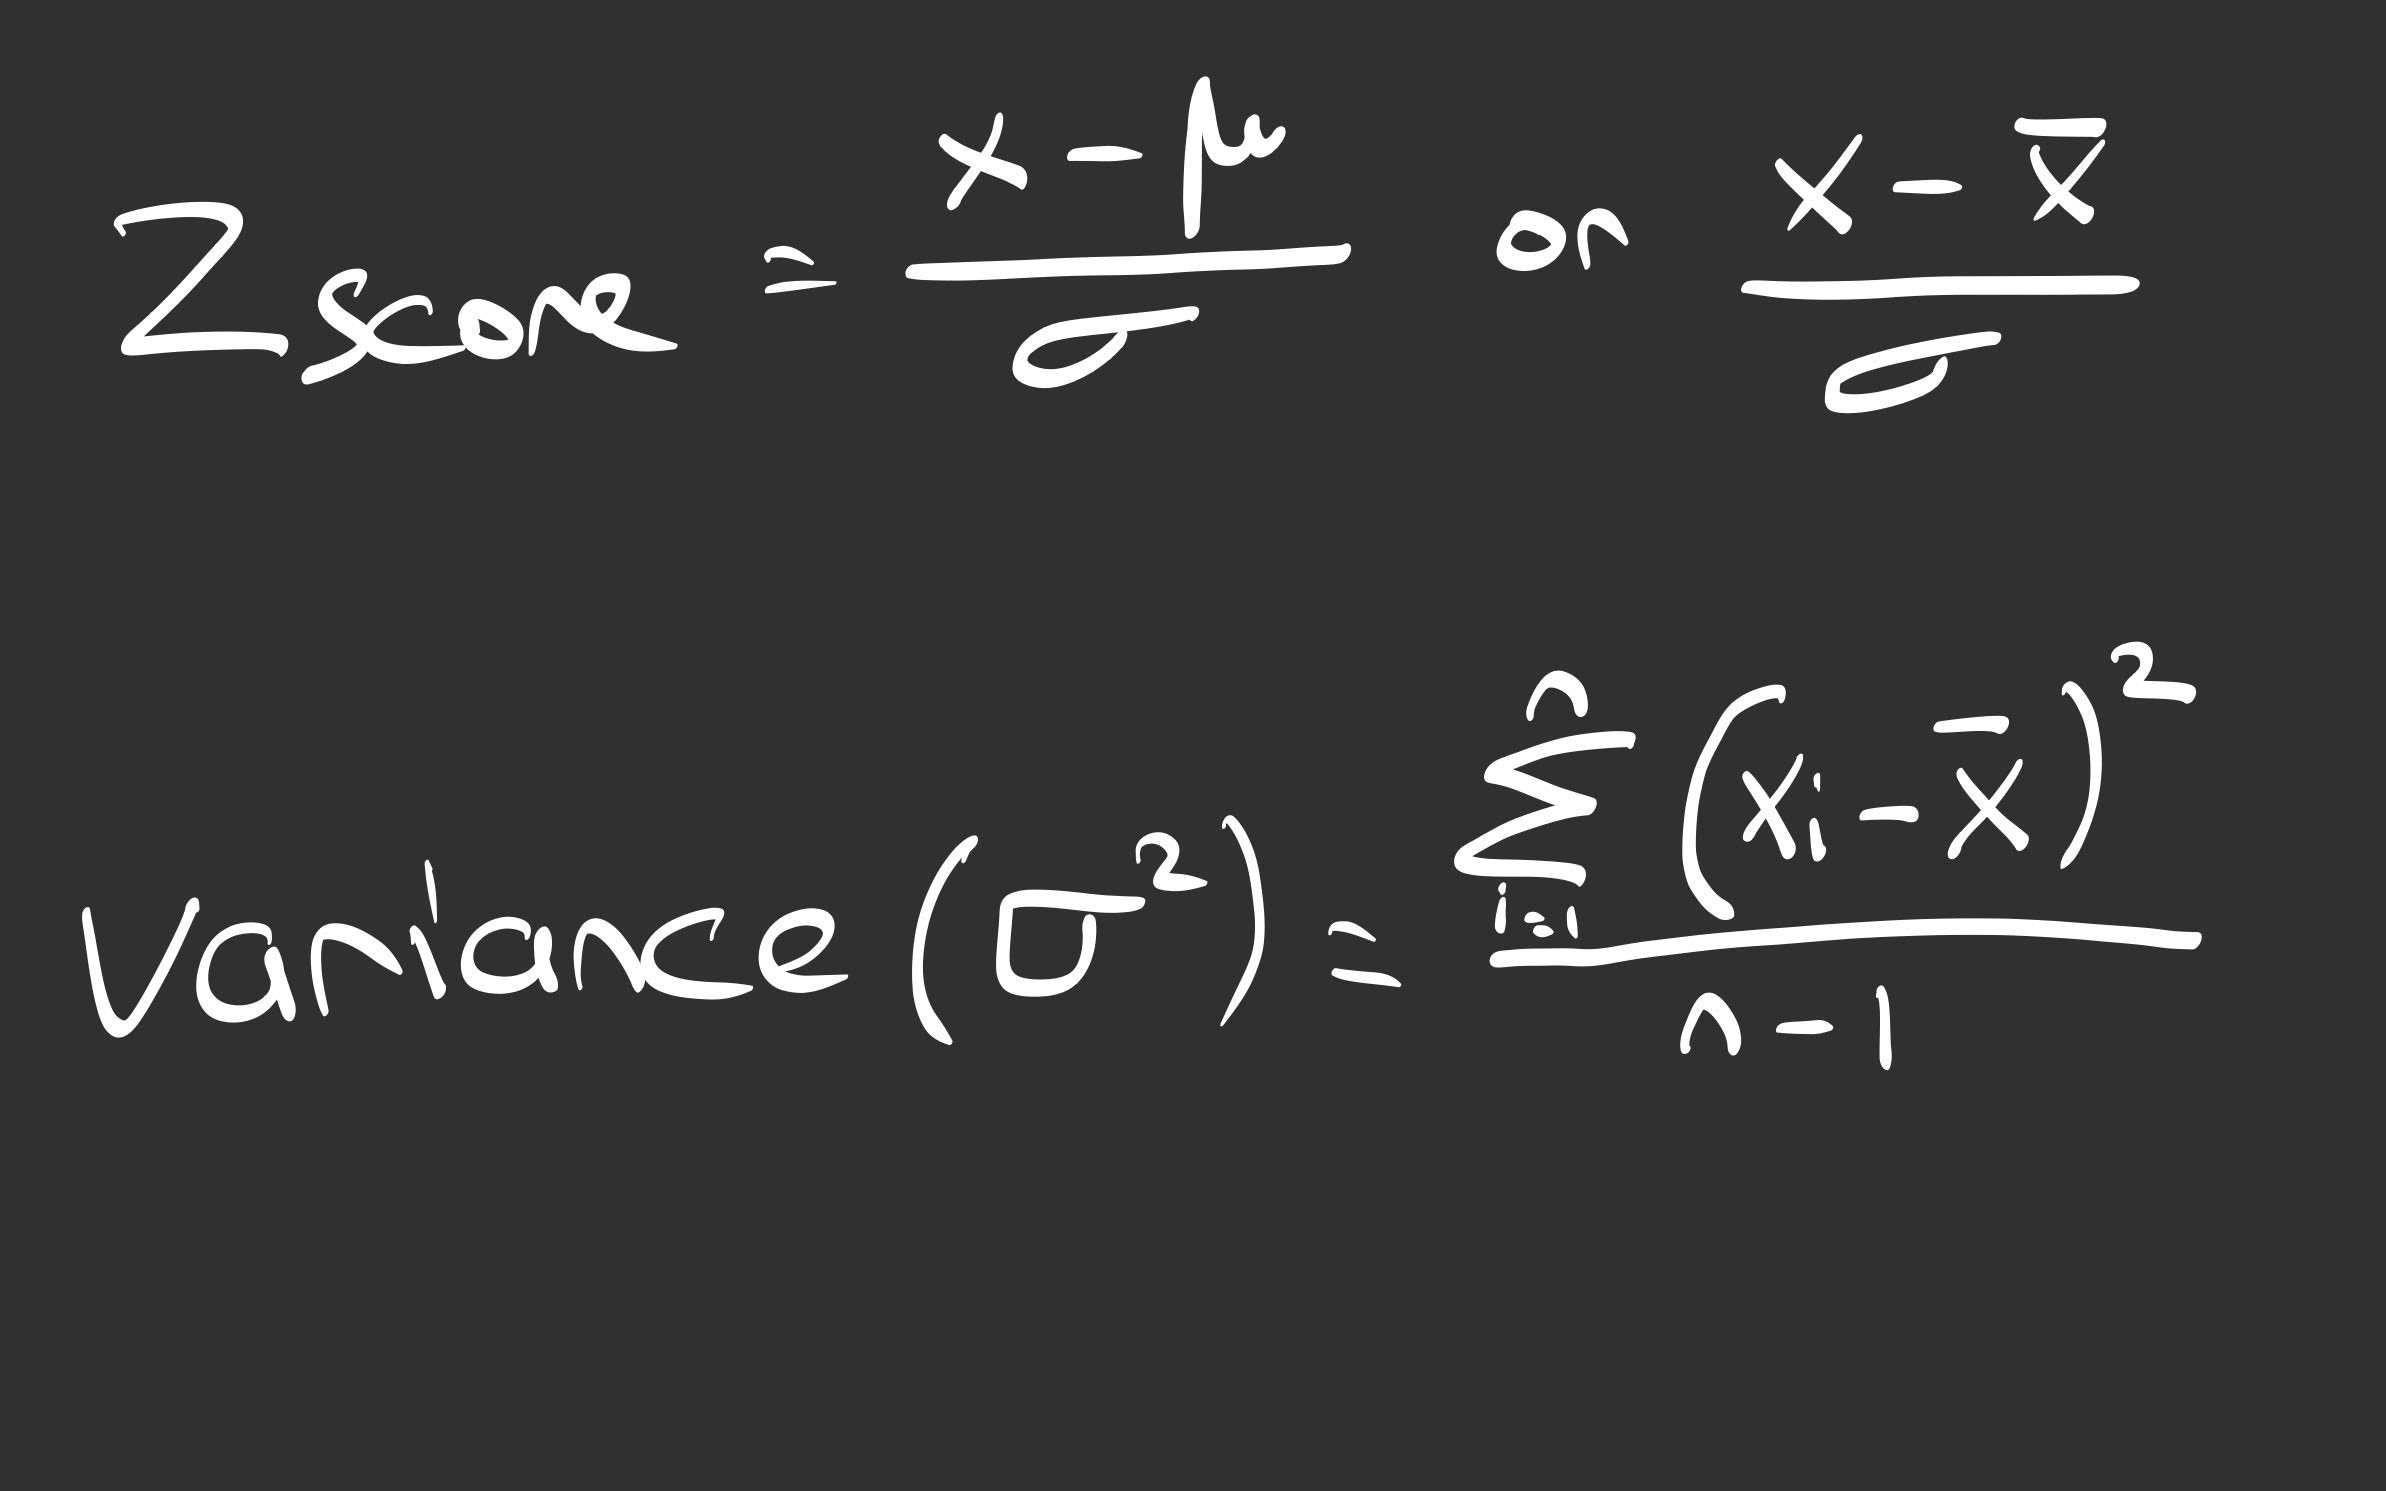 (My field notes on the formulas used in the code)
3. The Experiment: Building ErsuStatistics
I designed a Python class to encapsulate these formulas. The goal was to create an object that takes raw data and immediately calculates its “vital signs” (mean, variance, standard deviation).
Here is the source code for the engine:
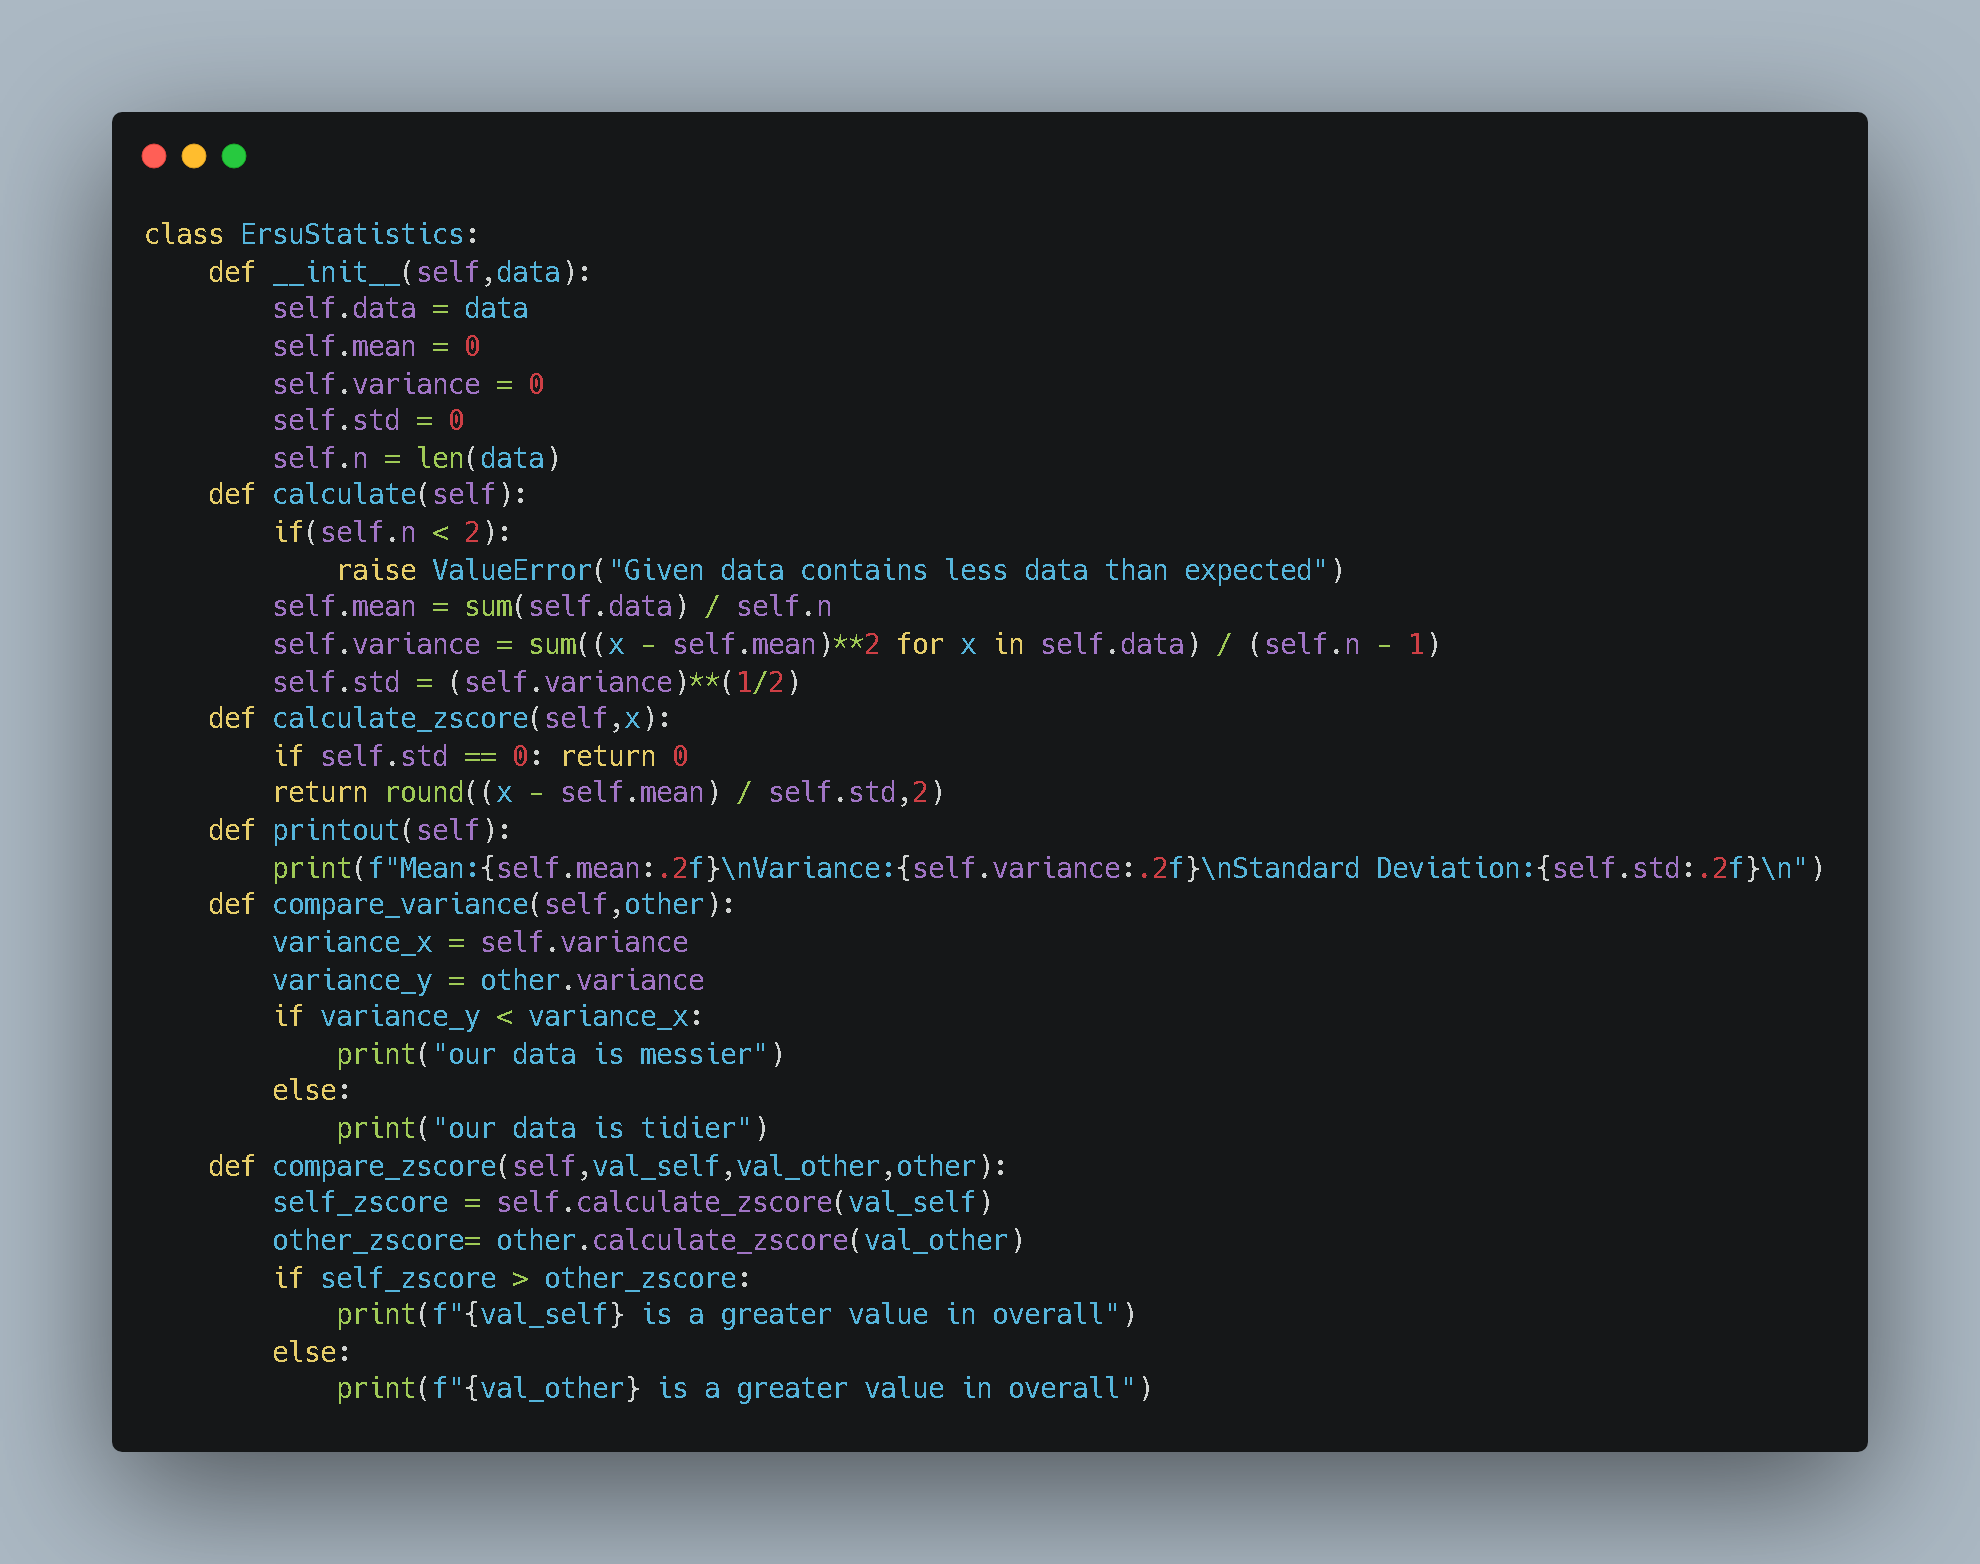
What’s happening here?
- Controlled Execution: I designed the class to distinguish between “setup” and “execution.” The
__init__method prepares the object, but the heavy math (mean, variance) is triggered only when I explicitly call thecalculate()method. - Bessel’s Correction: Notice the
(self.n - 1)in the variance calculation? That’s because we are working with samples, not populations. - Comparisons: I added methods like
compare_varianceandcompare_zscoreto make the objects interact with each other.
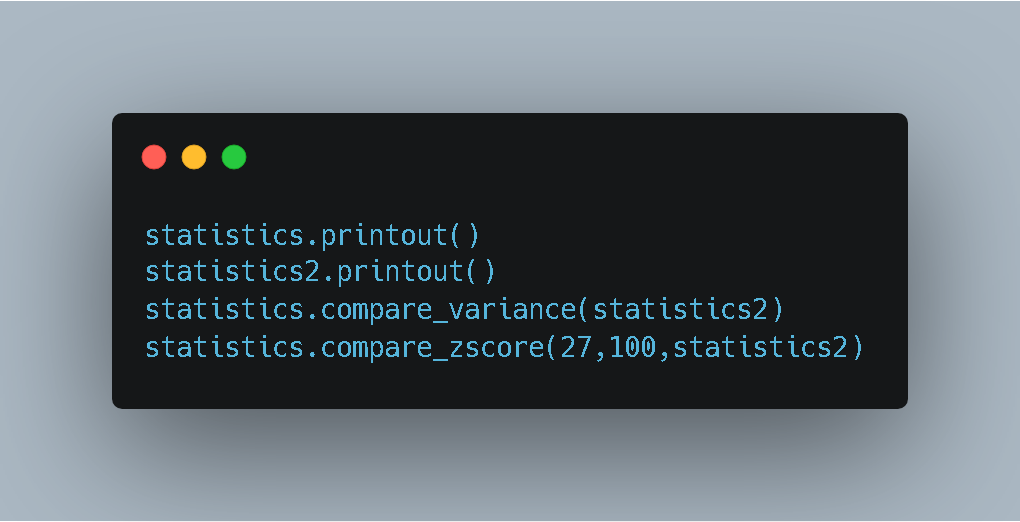
4. Setup and Execution
Now, let’s run the experiment. I created two distinct datasets:
- Data 1: Smaller numbers, seemingly tighter.
- Data 2: Larger numbers with a wider spread.
Here is the test setup:
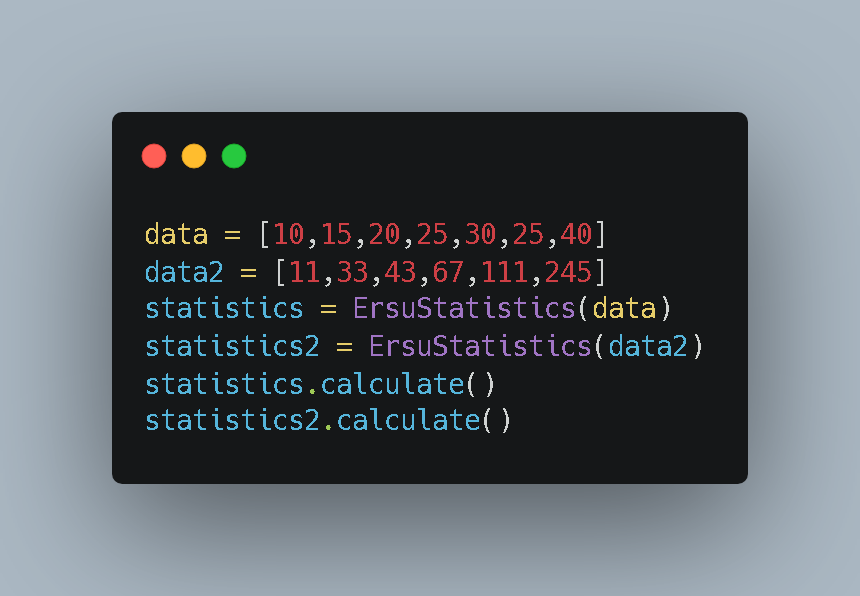
I wanted to answer two questions:
- Which dataset is “tidier” (has lower variance)?
- Is the value 27 (from Data 1) more impressive than the value 100 (from Data 2) relative to their own groups?
5. The Results
The console output gave us the verdict:
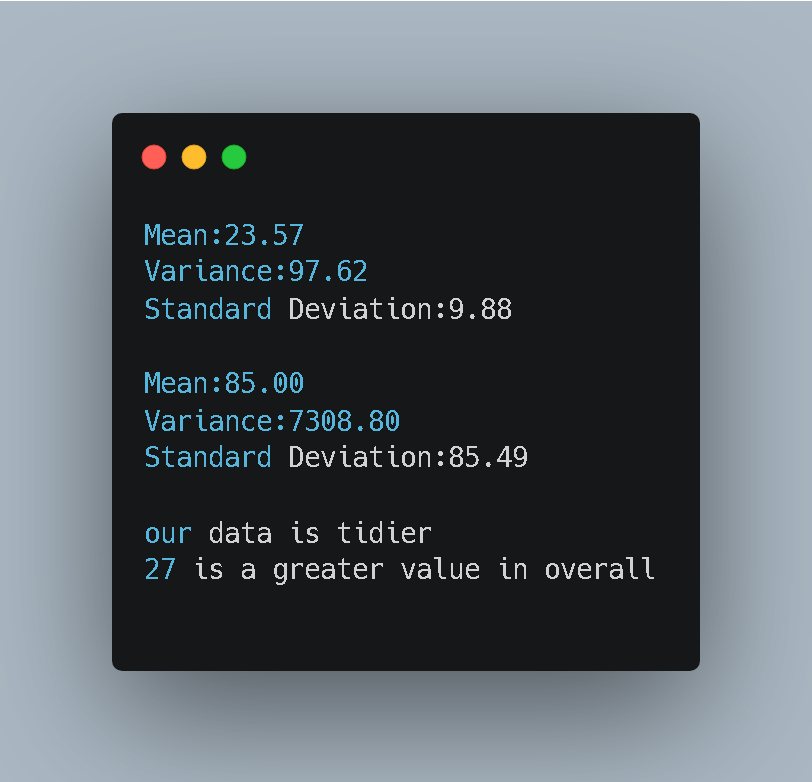
Analysis of the Output
- Variance: The code correctly identified that “our data is tidier.” Data 1 has a variance of ~97, while Data 2 has a massive variance of ~7308.
- The Z-Score Surprise: Look at the last line.
- My value was 27.
- The rival value was 100.
- Result: “27 is a greater value in overall.”
How? Value 100 is numerically larger, but in its group (Data 2), the standard deviation is huge (85.49). Being 100 in that group is nothing special. However, in Data 1, the standard deviation is small (9.88). Being 27 when the average is 23 is a significant jump.
Conclusion
Building this class taught me that context is everything. A number on its own means nothing without knowing the Variance and the Mean of its environment.
By writing the code from scratch, I moved from “using” statistics to “engineering” statistics.
See you in the next lab session. 🚀


